
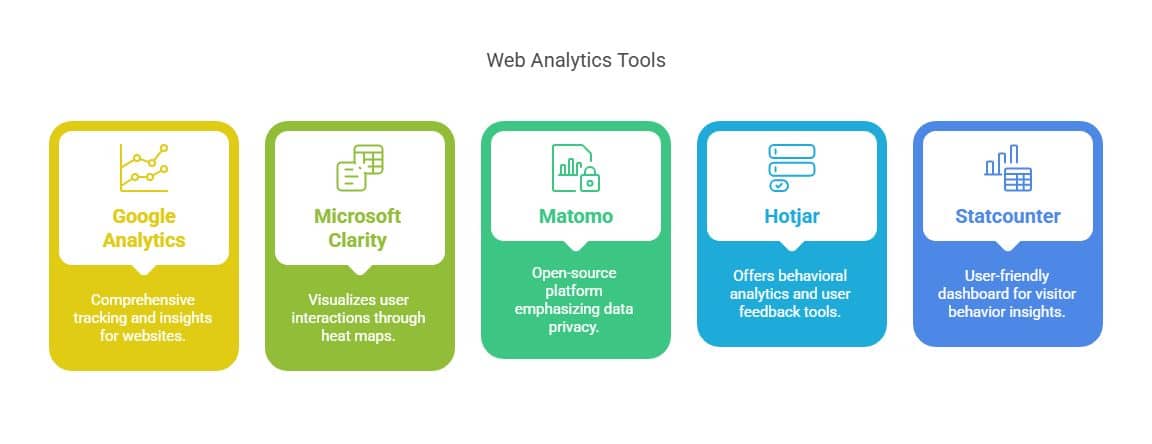
For beginners venturing into web analytics, top free tools include Google Analytics, Microsoft Clarity, Matomo, Hotjar, and Statcounter. Google Analytics gives detailed traffic analysis & reports you can customize. Microsoft Clarity offers heatmaps & recordings of user sessions to understand behavior. Matomo stands out with its strong emphasis on data privacy and custom tracking features. Hotjar combines behavioral analytics with user feedback functionalities, and Statcounter offers a user-friendly interface for traffic and interaction trend analysis. Each tool is uniquely tailored to provide insightful data, enabling users to make informed decisions and enhance their online strategy. Discover additional nuances in the world of analytics tools.
Key Takeaways
Google Analytics Overview
A cornerstone in the realm of digital analytics, Google Analytics offers robust capabilities for tracking and analyzing website traffic. This tool gives important information about how users act. Businesses can then make good decisions based on that.Central to its functionality is its data tracking capability, which allows users to monitor various metrics such as page views, session duration, and bounce rates. This data is crucial for understanding how users interact with a site, revealing patterns that can inform strategic adjustments.
Goal setting within Google Analytics is another key feature, allowing businesses to define specific objectives, such as lead generation or sales conversions. This functionality helps organizations measure success against predetermined targets, providing clarity in performance assessment. By establishing goals, users can track progress and identify areas requiring improvement, thus facilitating data-driven decision-making.
Report generation in Google Analytics is both versatile and user-friendly, offering standard and customizable reports. These reports provide a detailed analysis of website performance, user demographics, and traffic sources.People can utilize this capability to obtain detailed information about different aspects and measurements. This helps them better comprehend audience involvement and the success of their marketing efforts.
Moreover, Google Analytics boasts extensive integration options, making it a versatile addition to any digital marketing stack. It seamlessly connects with other Google tools such as Google Ads and Google Search Console, as well as third-party applications, thus ensuring a cohesive flow of data across platforms. The ability to integrate with other systems makes the tool more useful. It allows you to see your marketing efforts and results as a whole.
Microsoft Clarity Features

Microsoft Clarity, a powerful tool in the analytics landscape, offers unique features designed to enhance user experience analysis. As a free solution, it provides invaluable insights into user behavior, making it an excellent choice for beginners looking to understand website interactions. Clarity’s robust feature set allows users to delve deep into how visitors engage with their sites, which can significantly inform strategies for improving user experience and boosting conversions.
One of Clarity’s standout features is its heat mapping capability. This tool visualizes where users click, scroll, and spend the most time on a webpage. By utilizing heat maps, website owners can identify popular sections of their content and areas that may require redesign to capture more attention. This visual insight into user behavior is instrumental in optimizing website layouts and content placement.
Session recordings further enhance Clarity’s offering by providing real-time playback of individual user sessions. This feature allows users to observe firsthand how visitors navigate their site, uncovering potential pain points or areas of confusion. These recordings are crucial for understanding the user journey and refining user interfaces to improve accessibility and engagement.
Clarity also excels in conversion tracking, offering insights into how well a site converts visitors into customers or subscribers. By analyzing these conversion paths, users can implement targeted strategies to enhance conversion rates, ultimately driving business success.
Additionally, Microsoft Clarity encourages user feedback collection, seamlessly integrating with other feedback tools. This feedback is vital for understanding user expectations and experiences, ensuring that websites evolve to meet user needs effectively.
Matomo Capabilities

With its robust capabilities, Matomo stands out as a comprehensive open-source analytics platform tailored for those seeking both privacy and control over their data. Unlike many proprietary solutions, Matomo places a strong emphasis on data privacy, allowing users to retain full ownership of their information. This focus is especially appealing to organizations and individuals concerned with adhering to strict privacy regulations.
The Matomo user interface is intuitively designed to cater to both beginners and advanced users, providing a seamless experience in navigating through various analytics functionalities. Users can easily access a wide range of Matomo tracking features, which include real-time visitor insights, heatmaps, and goal tracking, ensuring a thorough understanding of user behavior on their websites.
Matomo offers more features through its report customization choices allowing users to modify reports for their particular analysis requirements.This feature ensures that stakeholders receive relevant and insightful information, enhancing decision-making processes.
For those seeking to integrate Matomo with other systems, the platform offers numerous integration options, allowing seamless connectivity with various content management systems, e-commerce platforms, and marketing tools. This flexibility ensures that Matomo can be effectively incorporated into diverse digital ecosystems, providing a cohesive analytics experience.
To encapsulate the key strengths of Matomo, consider the following:
- Data Privacy: Full control over data, complying with privacy regulations.
- User Interface: Intuitive design suitable for all experience levels.
- Tracking Features: Comprehensive tools for detailed user insights.
Hotjar Insights
Hotjar Insights provides a powerful suite of behavioral analytics and feedback tools designed to help users understand how visitors interact with their websites. By utilizing Hotjar heatmaps, users can visualize where visitors click, move, and scroll on a page, offering critical insights into user behavior and engagement levels. This visual representation helps identify user preferences and potential areas for improvement in website design and content placement.
In addition to heatmaps, Hotjar offers session recordings, which allow users to watch real-time visitor interactions on their site. These recordings provide a detailed look at user navigation paths, helping identify stumbling blocks that may hinder the user experience. Through session recordings, businesses can better understand user intent and improve site usability accordingly.
Hotjar also facilitates user feedback collection via customizable surveys and polls. This feature enables direct communication with users, gathering qualitative data that complements quantitative analytics. By leveraging user feedback, companies can gain deeper insights into customer satisfaction and areas needing enhancement, thus driving informed decision-making.
Another significant feature is Hotjar’s conversion funnels, which track the steps users take to complete specific actions, such as making a purchase or signing up for a newsletter. This analysis highlights where visitors drop off in the conversion process, allowing businesses to optimize these pathways and increase conversion rates.
Statcounter Basics

Statcounter provides a simple yet robust analytics tool tailored for beginners who want to better comprehend their website’s traffic. Its user-friendly interface and extensive features render it an ideal option for those new to web analytics. The platform shines with its intuitive Statcounter dashboard navigation enabling users to easily access a broad range of data insights.
- Statcounter Traffic Analysis: This feature provides detailed insights into the volume and behavior of visitors, enabling users to grasp the patterns and trends of their website traffic. Newcomers can easily identify which pages attract the most visitors and how users interact with the site.
- Statcounter Report Generation: With its efficient report generation capabilities, Statcounter allows users to create customized reports that highlight key metrics and insights. These reports are crucial for tracking the performance of a website over time, and can be tailored to focus on specific data points that are most relevant to the user’s objectives.
- Statcounter User Segmentation and Goal Tracking: This feature enables users to segment their audience based on various parameters such as location, device, and behavior.
Additionally, goal tracking allows users to set specific objectives, such as form submissions or downloads, and monitor their achievement over time. This provides a clear picture of how well the site meets its targets and where improvements can be made.
Final Thoughts
For beginners, selecting the right free analytics tool can provide foundational insights into website performance and user engagement. Tools like Google Analytics, Microsoft Clarity, Matomo, Hotjar, and Statcounter offer diverse functionalities, from traffic analysis to user session recordings and conversion tracking. By leveraging these tools, users can gain a deeper understanding of visitor behavior, optimize content placement, and refine user experience strategies. This knowledge forms a critical base for data-driven decision-making, supporting effective online growth and engagement.
Ready to unlock the full potential of your website through expert analytics? Connect with Syville Gacutan, an experienced SEO Specialist in the Philippines. Get personalized insights, actionable strategies, and hands-on support to optimize your website’s performance. Let’s turn data into success—reach out today!